In a new working paper on the effects of assortment size on purchase probabilities, my coauthors (Xueming Luo & Zhijie Lin) and I try to take advantage of a food delivery app’s delivery radius constraints that lead to quasi-exogenous variations in kitchen assortment sizes. In its most simplistic form, I visualized the following thought experiment:
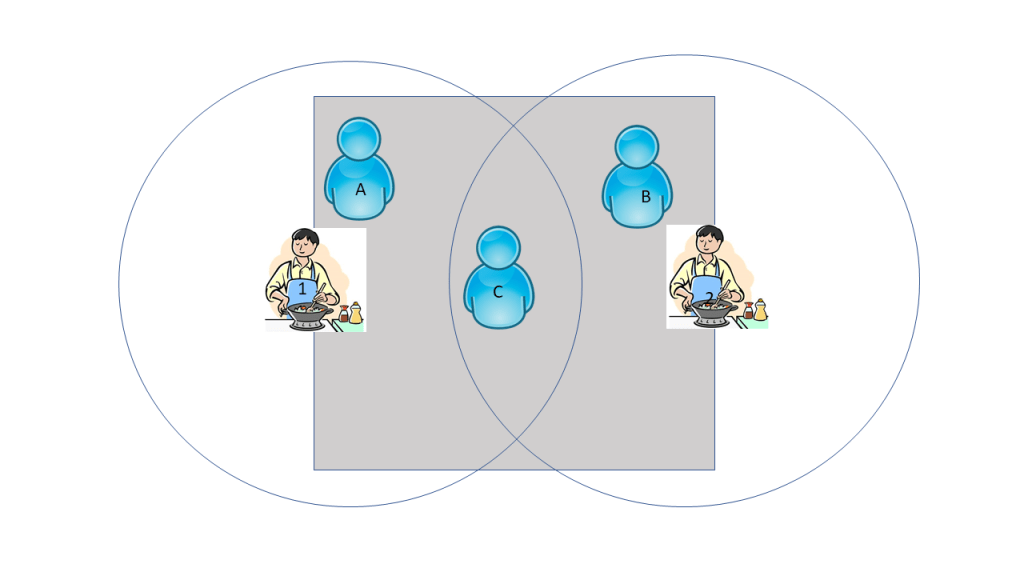
Two kitchens are both available on this platform, but only user C has access to both; users A and B can each only see kitchen 1 and 2, respectively. C is exposed to greater assortment, and hopefully this is related to some important outcome, like purchase. This kind of quasi-experimental design is an ideal example of “border identification.” Users A and B are not that different from user C, they just happen to be outside the delivery cutoff for kitchen 2 and 1, respectively. Therefore, we can treat the various assortment sizes in this local comparison as “quasi-exogenous” (academic-speak for “almost-random”). To gauge the effect of assortment on purchase using the canonical border identification strategy, we can just compare individuals like A and B to individuals like C who are located close to each other but receive different treatments.
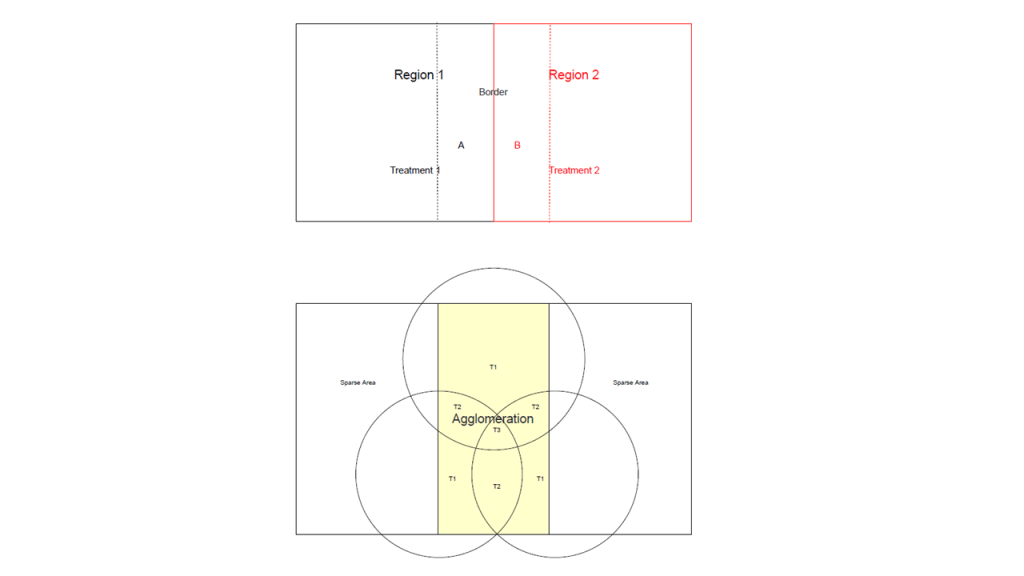
Of course, no research is this straightforward. The real world is not as clean as users A-C and kitchens 1&2. It’s more like users 1-a million and kitchens 1-7 thousand, and that’s just for a 3-month span in one major city. The result is that adjacent users often differ very slightly in their exposed assortment size. This poses import roadblocks for applying the canonical border identification strategy. First, the number of units in treatment regions (set of users exposed to the same treatment) is often just 1 (or some small number). Therefore, we would not be able to get a precise estimate of the effect of the assortment on the individual’s purchase behavior. If one were to run an actual experiment, one would ideally like to have at least 30+ subjects in each treatment group. Second, the variation in assortment sizes for “bordering” users are too small to yield any significant difference in purchase behavior. Third, on a more practical consideration, we don’t actually have well-defined borders, so it is difficult to apply the standard border identification strategy directly.
What we did instead. Rather than comparing individuals at “border” regions, we took a slightly different but still related approach. We first define what it means for users to be “close” to each other. This is done via geographic clustering. Having defined “close enough” users, then we can compare the outcomes of various assortment size treatments to each other. Of course, this is not as ideal as the standard border-identification case, and therefore we must do more robustness checks to show that our results are not sensitive to variations in the way we define “close enough.” Practically speaking, we check that our results are not sensitive to the hyperparameter choice in our geographic clustering step and that our results still hold when we use geographic neighborhood definitions from third party data sources. One can also view our approximate border identification strategy as a matching estimator where consumers are matched on geographic location, within which we assume variations in assortment are not due to endogenous supplier entry decisions. We visualize the differences between the canonical border identification strategy and our strategy below. The top panel shows a border identification strategy where A and B are part of different treatment groups but are located in proximate areas. The bottom panel shows our approximate border strategy where there are many users who live close to each other and are also subjected to different treatment levels.
In this particular application, we find that assortment size has an inverse “U” relationship with purchase probabilities. There is a large initial gain to increasing assortment (this is why delivery apps aggressively add restaurants to their site). However, this gain quickly plateaus beyond 150 options. At more than 300 options, the effect of assortment size actually decreases purchase rates. This is consistent with some of the classic research on choice overload.
In a separate working paper, my coauthors (Alex Chaudhry & Amit Pazgal) and I apply a similar argument to identify the causal impact of online review platform penetration and (perceived) hotel quality. We argue that areas of hotel agglomeration often span more than one city, and that the popular review site, TripAdvisor, makes landing pages and hotel rankings lists based on city boundaries. Some cities get more attention than others on TripAdvisor, and therefore, the differences in attention within areas of hotel agglomeration lead to different incentives to compete on quality (more reviewer scrutiny = more incentive to compete on quality). Consequently, independent hotels that were unable to signal their quality through branding end up improving their quality when they are located in a higher penetration city within an area of hotel agglomeration.

One thought on “Approximate border identification”