The bullet point takeaways:
- Track crowds.
- Economic devastation happened with or without SIP.
Link to most recent draft of working paper
Like many academics, I’ve recently tossed my proverbial thinking hat into the ring to investigate the causal impact of shelter in place (SIP) policies on public health and social distancing outcomes. This is clearly a topic of interest for pretty much every epidemiologist and many economists right now. While epidemiologists generally model contagion using SIR models with the goal of predicting transmission patterns, economists generally approach the problem from a program evaluation perspective (i.e. did the SIP policies work?). Epidemiological models generally treat social distancing behavior and shelter in place policies as the same thing, making hypothetical assumptions about individuals’ compliance rates. Econometric models try to make causal links between policy and outcomes. My thinking falls into the latter category.
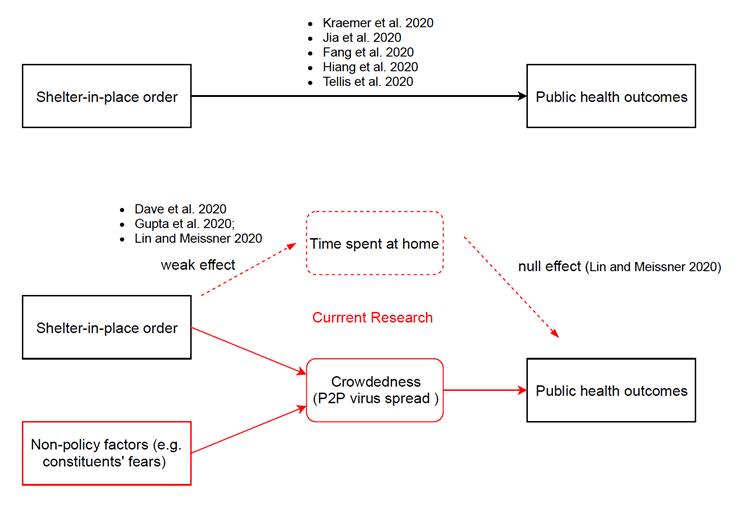
While some models suggest that SIP policies had a massive impact on infection rates, most research documents only negligible effects for SIP policies on social distancing (SD) behaviors or SD behaviors on infection rates. We believe these seemingly incompatible findings are due to two reasons.
- Using a single year’s traffic data does not account for the differences in seasonal patterns of SD behaviors between counties which confounds the relationship between SIP and SD.
- SD behavior as measured in current research does not account for “crowdedness” – they only measure traffic volume. Need to account for the size of enclosed areas in addition to volume of traffic flow.
To address #1, we use data from March 1st through May 31st 2020 and the corresponding data from the same days in 2019 in a triple differences paradigm. Under triple differences, we use a regression model to “compute” the between pre and post (1st diff) SIP intervention counties’ year over year changes (2nd diff) in SD behavior with corresponding metrics of counties without such interventions over the same time frame (3rd diff).
To address #2, we compute a measure of crowdedness using venue level cell phone tracking data from SafeGraph. With this data, we compute crowdedness as the average number of sampled individuals per square foot encountered by a random individual outside their home in each county on each day.
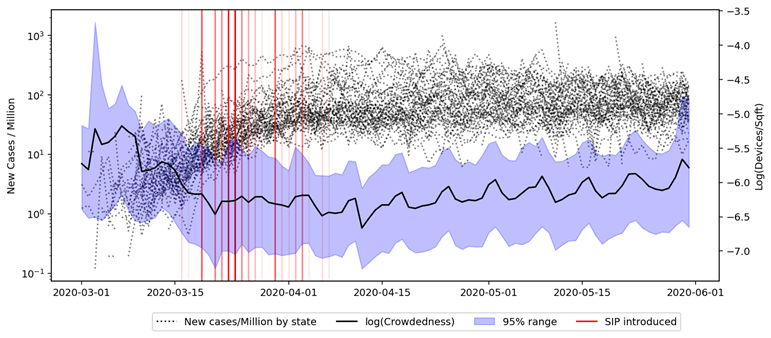
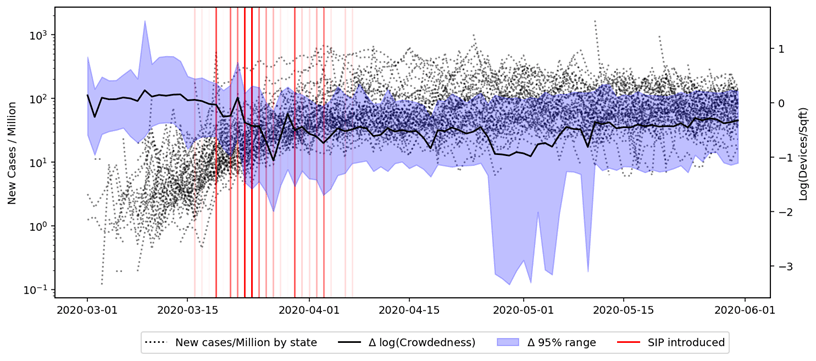
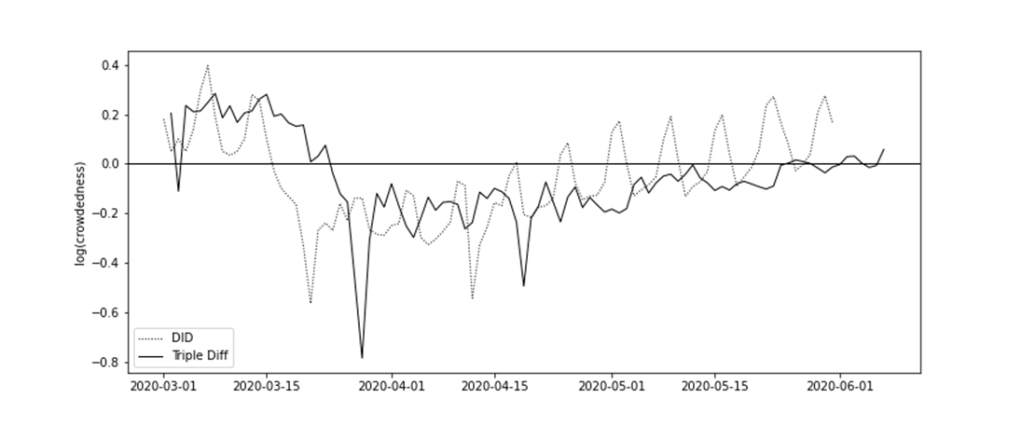
Turning to the raw data, we show why it is important to consider “normal” crowding behavior. In the first figure, we seem to observe crowds starting to mitigate before SIP policies are implemented. However, once considering county year over year differences, we see a pattern more consistent with causality. The measure of crowdedness seems to to decrease after SIP policies are implemented.
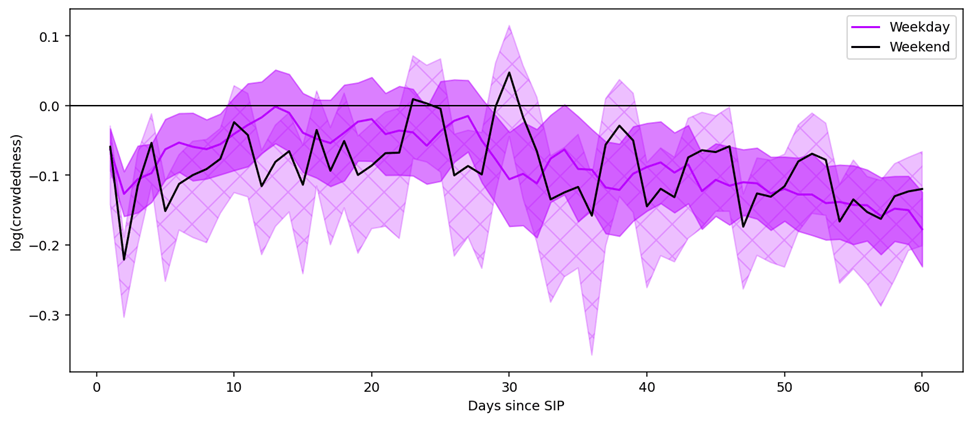
Based on these insights above, we use a triple differences model to estimate the causal effects of SIP. We find that policies roughly decreased crowdedness by 10%. Non-policy related changes to crowdedness (any systematic difference between 2020 and 2019 not attributable to SIP or weather) was about equal in magnitude. However, the two types of effects are trending in opposite directions. While SIP induced changes in crowdedness is increasing in magnitude, our analysis suggests that non-policy induced changes in behaviors are disappearing by the end of May.
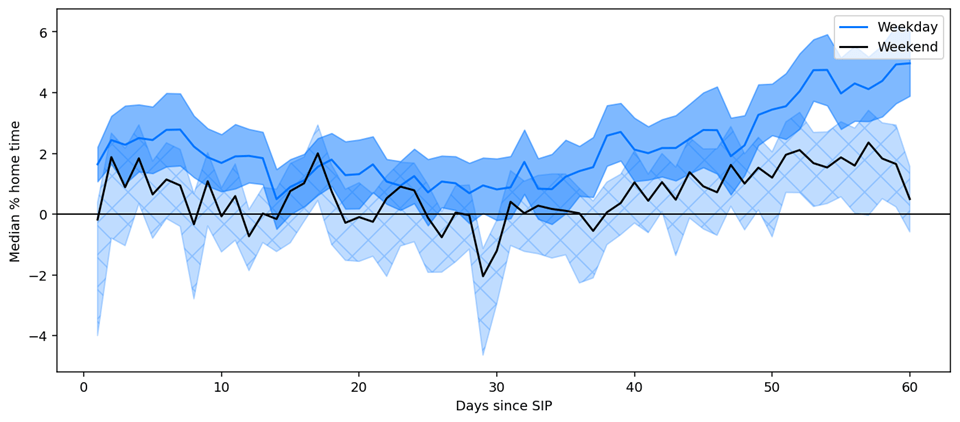
In addition to the effect on crowdedness, we also find that SIP policies affected time spent at home and some work traffic behaviors. However, non-policy factors had much larger effects on these variables.
So, did how much did crowdedness or time at home decrease infections spread? To evaluate this link in the causal chain, we use weather as instrumental variables. The idea is that local daily variations in weather induces traffic unrelated to infection rates, so the we can use the variation in SD behaviors due to weather changes to estimate the impact of SD on infections. To account for the 3-10 day incubation period, we use 2 week averages of SD, SIP policy indicators, and weather variables in our instrumental variable analysis. We find that 10% decrease in crowdedness decreases infection growth rate by 1-1.5% while time at home exhibits no statistical link to infection growth rates. In total, we find that changes in crowdedness caused by SIP policies induces infection rate decreases that explain the entirety of the impact of SIP policies on infection rates.
So what’s the takeaway for policy makers?
- We need to focus policies and resources on tracking and controlling crowds.
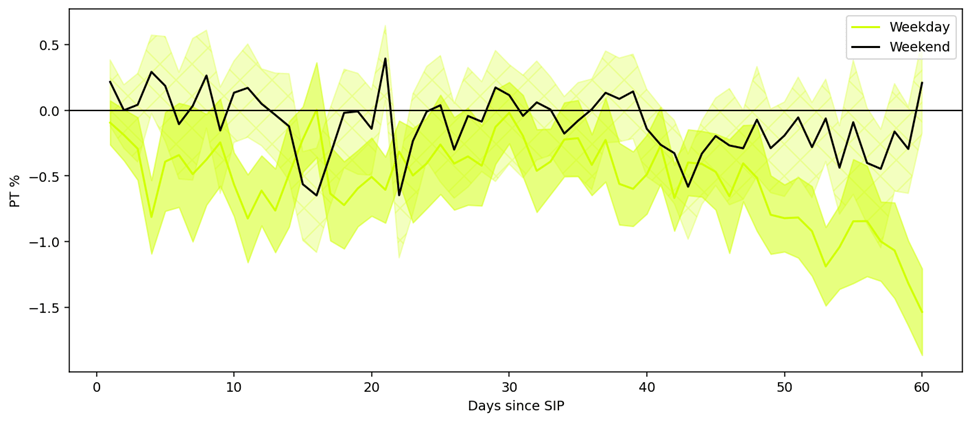
- The economic damage is done regardless of SIP. The impact of SIP policies on economic outcomes like full time / part time / delivery driving work behaviors are an order of magnitude smaller than the non-policy impact on the same outcomes.
